Monitoring a Jobs performance
Last updated on 2024-05-07 | Edit this page
Overview
Questions
- Why should I learn to monitor performance of my Slurm jobs?
- Which tools can I use to monitor my jobs’ activity?
Objectives
- Understand why jobs should be monitored carefully.
- Show common tools to use to monitor jobs’ activity and performance.
- Demonstrate a general procedure to investigate why a job may not be performing as expected.
Calculating \(\pi\)
You’re an honours student and your project is looking at ways of calculating \(\pi\). Your PI has recommended using an existing piece of software he saw someone talk about at a conference recently. A useful feature is that it works in parallel, and is consequently quite fast! You try running the program on your laptop, and it takes about 1.2 seconds for each calculation of \(\pi\). This is a little slow, so you try running it on Milton
OUTPUT
srun: job 11087600 queued and waiting for resources
srun: job 11087600 has been allocated resources
Result: 3.1414796637875 Error: -0.0001130772251 Time: 3.0970s
Result: 3.1417489401899 Error:  0.0001561991773 Time: 3.0912s
Result: 3.1415377569880 Error: -0.0000549840246 Time: 3.1001s
...
Each calculation of \(\pi\) takes about 3 seconds - slower than your laptop! This is something to remember about HPC: The main reason why HPC is “faster” is because it has many CPU cores, but the cores working individually are probably slower than your PC’s CPU cores. HPC’s usefulness comes from hundreds or thousands of CPU cores working in parallel!
You tell your supervisor that HPC isn’t helping! But they assure you that it should be really fast - the presenter at the conference demonstrated times way less than 3 seconds!
Your job now is to figure out why pi-cpu isn’t
performing fast for you.
Is it really working in parallel?
So far, we’ve only heard that the software works by
performing computations in parallel with multiple CPUs. One way we can
verify this is with the htop tool.
Run seff with your Job ID. For example, with a job ID of
11087600:
OUTPUT
Job ID: 11087600
Cluster: milton
User/Group: yang.e/allstaff
State: COMPLETED (exit code 0)
Nodes: 1
Cores per node: 2
CPU Utilized: 00:00:14
CPU Efficiency: 50.00% of 00:00:28 core-walltime
Job Wall-clock time: 00:00:14
Memory Utilized: 0.00 MB (estimated maximum)
Memory Efficiency: 0.00% of 20.00 MB (10.00 MB/core)
You should see that the job has requested 2 CPUs by default, and has an efficiency of roughly 50%. Definitely not parallel!
You might’ve also noticed that there’s no memory utilization information. We’ll discuss this later.
From seff, it looks like pi-cpu isn’t
working in parallel. But perhaps you haven’t requested enough resources
from Slurm? Let’s try double the number of CPUs requested to 4:
OUTPUT
srun: job 16555628 queued and waiting for resources
srun: job 16555628 has been allocated resources
Result: 3.1413745257865 Error: -0.0002182152261 Time: 3.1130s
Result: 3.1416269865888 Error:  0.0000342455762 Time: 3.1173s
Result: 3.1413426117862 Error: -0.0002501292264 Time: 3.1159s
Result: 3.1416289953888 Error:  0.0000362543763 Time: 3.1151s
Result: 3.1414934337876 Error: -0.0000993072250 Time: 3.1139s
Not much change in time to calculate pi. Using seff to
check the CPU utilisation:
OUTPUT
Job ID: 16555633
Cluster: milton
User/Group: yang.e/allstaff
State: COMPLETED (exit code 0)
Nodes: 1
Cores per node: 4
CPU Utilized: 00:00:16
CPU Efficiency: 25.00% of 00:01:04 core-walltime
Job Wall-clock time: 00:00:16
Memory Utilized: 0.00 MB (estimated maximum)
Memory Efficiency: 0.00% of 40.00 MB (10.00 MB/core)
and our efficiency has decreased proportionally with the number of CPUs we’ve requested.
OUTPUT
Usage:
    pi-cpu [options]

Options:
    --parallel <N>, -p <N>    Number of threads to use (default: 1)
    --trials <N>, -n <N>      Number of trials to calculate pi (default: 123,456,789)
    --reps <N>, -r <N>        Number of times to calculate pi (default: 5)
where <N> is an integer.
It looks like we need to use the --parallel or
-p option! Let’s try this with our previous command:
OUTPUT
srun: job 16555642 queued and waiting for resources
srun: job 16555642 has been allocated resources
Result: 3.1417442421899 Error:  0.0001515011773 Time: 1.0078s
Result: 3.1415662365883 Error: -0.0000265044243 Time: 1.0076s
Result: 3.1415902773885 Error: -0.0000024636241 Time: 1.0070s
Result: 3.1415876205884 Error: -0.0000051204241 Time: 1.0122s
Result: 3.1414994277876 Error: -0.0000933132249 Time: 1.2378s
The run times have decreased significantly! And checking the
efficiency with seff:
OUTPUT
Job ID: 16555642
Cluster: milton
User/Group: yang.e/allstaff
State: COMPLETED (exit code 0)
Nodes: 1
Cores per node: 4
CPU Utilized: 00:00:20
CPU Efficiency: 83.33% of 00:00:24 core-walltime
Job Wall-clock time: 00:00:06
Memory Utilized: 0.00 MB (estimated maximum)
Memory Efficiency: 0.00% of 40.00 MB (10.00 MB/core)
Shows that CPU efficiency is now >80%! Turns out we needed to read the instructions carefully first!
Many programs behave like this: they will have parallel capability
built in, but will need to be switched on perhaps with a flag/option
like with pi-cpu. Sometimes it can also be switched on via
an environment variable.
Parallel programs are generally designed to run in this way so that the parallel program doesn’t unintentionally use up all the resources on the machine you’re running on.
Seeing the effects of Hyperthreading
Before, we tried requesting more CPUs from Slurm, but that didn’t
change much about how the program itself ran. But now that we’re using 4
CPUs with pi-cpu and also requesting 4 CPUs from Slurm. But
what happens if we double this request from Slurm again (without
increasing the number passed to -p)?
Try doing that by requesting 8 CPUs from Slurm. After, try doubling it again and requesting 16 CPUs.
OUTPUT
srun: job 16555656 queued and waiting for resources
srun: job 16555656 has been allocated resources
Result: 3.1417761237902 Error:  0.0001833827776 Time: 0.6896s
Result: 3.1416477873890 Error:  0.0000550463764 Time: 0.6908s
Result: 3.1416972621894 Error:  0.0001045211769 Time: 0.6859s
Result: 3.1413705729865 Error: -0.0002221680261 Time: 0.6859s
Result: 3.1418576745909 Error:  0.0002649335783 Time: 0.6858s
Oh, the time almost halved! If you check the efficiency of
seff, you should see that the efficiency if roughly 50%. If
we try double the CPUs requested to 16:
OUTPUT
srun: job 16555928 queued and waiting for resources
srun: job 16555928 has been allocated resources
Result: 3.1414441209871 Error: -0.0001486200254 Time: 0.6897s
Result: 3.1415679861883 Error: -0.0000247548243 Time: 0.6862s
Result: 3.1418510649908 Error:  0.0002583239783 Time: 0.6854s
Result: 3.1416825849893 Error:  0.0000898439767 Time: 0.6852s
Result: 3.1415102493877 Error: -0.0000824916248 Time: 0.6853s
But this time, the time has stayed the same. So why does
pi-cpu -p 4 benefit from requesting 8 CPUs from Slurm?
This is because Milton’s Slurm is configured such that when you request 1 CPU, you’re actually getting a hyperthread. For every two hyperthreads, you get one physical CPU core.
So, when you execute srun -c 4 pi-cpu -p 4,
pi-cpu -p 4 is actually executed on a two physical cores.
But thanks to hyperthreading, you manage to get some speedup almost for
free! When you execute srun -c 8 pi-cpu 4,
pi-cpu is now running on two separate physical cores, hence
we see a speedup!
This is important to remember because if you forget about how Slurm
CPUs are equivalent to hyperthreads, rather than physical CPU cores,
programs that run in parallel might appear less efficient (like in the
case of pi-cpu!).
NOTE: this configuration is unique to Milton. Most other HPC facilities equate Slurm CPUs to physical CPU cores, not hyperthreads.
Discussion
What might happen as we add more CPUs? Most parallel programs eventually reach a point where trying to use more CPUs doesn’t actually decrease the run time of the program in a linear manner. It may be useful to experiment on your program and/or input data to see when it stops being worth it to add CPUs (AKA performing a “scaling study”)
Getting more information from a running job
We’ve used seff so far to get resource utilisation of a
job. However, this only works for a complete job, not for a running job.
Instead, Slurm offers the sstat tool to obtain information
about a running job. This way, we can check on the utilisation while the
job is running.
let’s start a long-running job with our pi-cpu
program:
OUTPUT
Submitted batch job 16559207Check that the job is running with squeue:
OUTPUT
             JOBID PARTITION     NAME     USER ST       TIME  NODES NODELIST(REASON)
16559207 regular wrap yang.e R 0:01 1 il-n11Running sstat with a job ID on it’s own doesn’t work,
you need to remember to pass the -a flag:
OUTPUT
JobID         MaxVMSize  MaxVMSizeNode  MaxVMSizeTask  ...
------------ ---------- -------------- --------------  ...
16559207.ex+    108056K         il-n11              0  ...
16559207.ba+    136648K         il-n11              0  ...
There’s a lot of output! By default, sstat will dump
everything it can about the job onto your terminal. To control what
output gets shown, you can use the -o option and supply
some fields. Below is a recommended command you can use in the
future:
And below is an example output:
OUTPUT
          JobID             Nodelist     AveCPU     MaxRSS MaxDiskWrite  MaxDiskRead
--------------- -------------------- ---------- ---------- ------------ ------------
16559207.extern               il-n11   00:00:00        98K        1.00M         2012
 16559207.batch               il-n11   00:07:53       818K         8309        17747
Which is much more comprehendable!
Challenge
the arguments to pass to sstat -ao have been supplied
here for convenience. But, you can create your own! Use the
sstat --helpformat command to see which available fields
there are. You’ll also want to check the man page for
sstat to find out exactly what these fields mean.
What do the fields in the previous sstat command mean?
reminder: the command is
sstat -ao jobid%15,nodelist,avecpu,maxrss,maxdiskwrite,maxdiskread <jobid>.
From the Job Status Fields section in the man page, we
can see that:
- AveCPU Average (system + user) CPU time of all tasks in job.
- AveDiskRead Average number of bytes read by all tasks in job.
- AveDiskWrite Average number of bytes written by all tasks in job.
- JobID The number of the job or job step. It is in the form: job.jobstep
- MaxDiskRead Maximum number of bytes read by all tasks in job.
- MaxDiskWrite Maximum number of bytes written by all tasks in job.
- MaxRSS Maximum resident set size of all tasks in job.
Nodelist is left out, but hopefully that’s self-explanatory.
To summarize, the Slurm utilities you can use to monitor your jobs are:
-
squeueis good for getting the status of running or pending jobs, but don’t offer much in terms of utilization information. -
sacct, with output formatting can be used to view resource utilsation of jobs that have ended.-
seffserves a similar purpose tosacct, but with the output presented in a more easily understood manner.
-
-
sstatcan be used to query resource utilisation of a running job. But also requires some output formatting.
Investigating memory usage of pi-cpu2
In the example programs, there should be the pi-cpu2
executable. Lets see what happens when we run it:
ERROR
srun: job 12064697 queued and waiting for resources
srun: job 12064697 has been allocated resources
slurmstepd: error: Detected 1 oom_kill event in StepId=12064697.0. Some of the step tasks have been OOM Killed.
srun: error: il-n01: task 0: Out Of Memory
Ok, that wasn’t what we expected! The error message says that our job
was OOM Killed and that task 0: Out Of Memory.
Here, OOM is an abbreviation for Out Of Memory. The overall
error message is indicating that your job exceeded the memory allocation
of your job, which caused Slurm to cancel it. If we use
seff on that job:
OUTPUT
Job ID: 12064697
Cluster: milton
User/Group: yang.e/allstaff
State: OUT_OF_MEMORY (exit code 0)
Nodes: 1
Cores per node: 2
CPU Utilized: 00:00:00
CPU Efficiency: 0.00% of 00:00:00 core-walltime
Job Wall-clock time: 00:00:00
Memory Utilized: 0.00 MB (estimated maximum)
Memory Efficiency: 0.00% of 20.00 MB (10.00 MB/core)
You will find that it produces only the requested resources and the
OUT_OF_MEMORY state and no utilization information is
found. Similarly, if we execute sacct, we should see
OUT_OF_ME+ and 0:125 under the
STATE and ExitCode columns, respectively:
OUTPUT
JobID           JobName  Partition    Account  AllocCPUS      State ExitCode
------------ ---------- ---------- ---------- ---------- ---------- --------
... skipped output...
12064697        pi-cpu2    regular       wehi          2 OUT_OF_ME+    0:125
12064697.ex+     extern                  wehi          2 OUT_OF_ME+    0:125
12064697.0 pi-cpu2 wehi 2 OUT_OF_ME+ 0:125The Slurm utilities can already tell you a lot of information that you’ll find useful when evaluating your Slurm jobs. However, there are some important limitations preventing these tools from being “all-purpose”.
- The information used by
seffandsacctare collected every 30 seconds only, and information isn’t collected about jobs that fail for any reason.- this makes it difficult to diagnose jobs that use too much memory.
- it also makes it difficult to identify sudden and short-lived spikes in resource usage.
- This is why for our short
pi-cpujob,seffdoesn’t show any memory usage!
-
sstatis limited in how frequently it can be used- if used too often, your
sstatcalls will be throttled. - this a system configuration to prevent Slurm from being overloaded.
- if used too often, your
Because of this, in some cases, it’s recommended to use system tools that don’t rely on Slurm’s infrastructure.
Introducing htop
htop is an interactive “process” viewer that lets you
monitor processes across the entire node. It’s very similar to Task
Manager on Windows or Activity Monitor on Macs, but it works from the
command line!
Interpreting htop’s output
Try running htop on the login node. You should get
something similar to below:
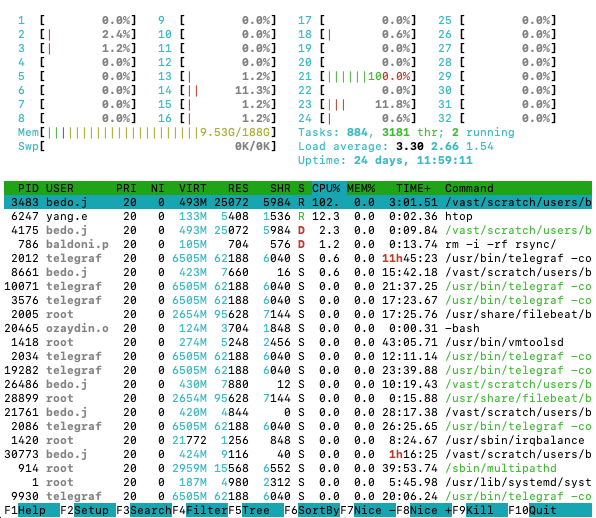
htop outputhtop gives a lot of information, so here is a quick
explainer on what is being shown.
At the top of the htop output, you’ll see multiple bars
and each bar tells you the activity level of a single CPU core. If a bar
is at 100%, then that means that that CPU core is completely busy.

htop
Below the bar, on the left side, is another bar which tells you how much of the node’s memory is occupied. Next to the bar is information about how much load the node is under.

htop
Everything below that is most important to monitoring your jobs. That table is a dynamic list of “processes” running on the node. And each column tells you a bit of different information about the process.
htop
-
REStells you the “resident” memory of the process, i.e., the memory (in bytes) being used by the process. -
CPU%is the percentage of a CPU core the process is using. -
Commandis telling you the command the process is running. This can be used to help you figure out which processes are related to your job.
By default, htop will show you everyone’s
processes, which is not relevant to us. To get only your processes, quit
htop by pressing q, and run it again with
You should see a list of processes that belong to you only!
Monitoring pi-cpu with htop
This time, we’re going to submit the pi-cpu command as a
job with sbatch. We’re also going to add the
-r -1 flag and value, so that the program will run
indefinitely. We can do so by
Once you’ve confirmed the job has started with squeue,
and determined which node it’s running on, ssh to that node
and run htop -u $USER.
OUTPUT
Submitted batch job 11088927OUTPUT
     JOBID PARTITION     NAME     USER ST       TIME  NODES NODELIST(REASON)
11088927 regular wrap yang.e R 0:12 1 sml-n15OUTPUT
yang.e@sml-n15s password: # enter your password
Last login: Fri Apr 14 14:40:38 2023 from slurm-login.hpc.wehi.edu.au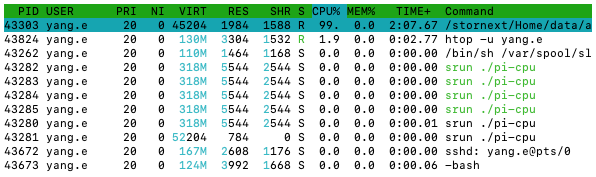
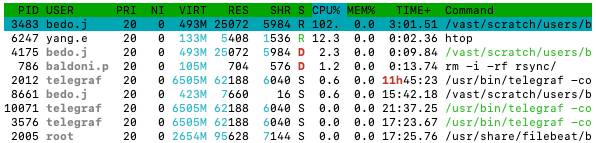
pi-cpu
From the Command column, you can find the relevant data
for your job.
Hint: You can click on CPU% to sort processes by their
CPU usage.
If we look at the CPU% column, we can see that the
pi-cpu process is using 100%! That might sound good, but
the percentage is the percentage of a CPU core being used,
i.e., 100% means that 100% of a single CPU core is being used, or 200%
means 100% of two CPU core are being used. So, the pi-cpu
process is only using 1 CPU core i.e., not parallel! This is not what
your PI promised!
But maybe it’s because we didn’t request more CPUs? We didn’t ask for any specific number of CPUs in our command after all. Let’s try request 4 CPUs instead. But first, let’s cancel the already running job.
And then we can try again, but with more CPUs:
OUTPUT
Submitted batch job 11089020OUTPUT
   JOBID PARTITION     NAME     USER ST       TIME  NODES NODELIST(REASON)
11089020 regular wrap yang.e R 0:12 1 sml-n15OUTPUT
yang.e@sml-n15s password: # enter your password
Last login: Fri Apr 14 14:40:38 2023 from slurm-login.hpc.wehi.edu.au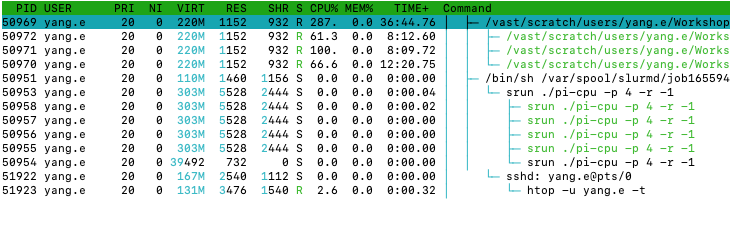
pi-cpu
after requesting more CPUs from SlurmWe can see that there is a process using around 300%-400% of CPU
which should have pi-cpu in the command column.
Challenge
htop is a Terminal User Interface (TUI) and allows you
to click on the interface to interact with it! What happens when you
click on CPU% and MEM%? What if you click on
the Tree button on The bottom?
After this, see if you can add disk read/write information columns to
the htop interface.
Hint: You’ll need to click on Setup in the bottom-left
corner and you may need to use your arrow keys!
Clicking on CPU% and MEM% will order the
processes by how much of those resoures are being used. Subsequent
clicks will reverse the order.
Clicking on Tree will group the processes by
sub-processes, so you can see which processes were spawned by which.
To add disk read/write columns, you can click on
Setup -> Columns -> press right twice to get the cursor to "Available Columns" -> scroll down with your arrow keys and press enter onIO_READ_WRITEandIO_WRITE_RATE`
Now, this job runs forever, so we should cancel it and move on.
Monitoring GPU activity
You’re consumed by the need-for-speed, and you’re ready to try the
pi-gpu program published by the same authors! When running
the program, you will need:
- 1GB memory
- 1 GPU (of any kind)
- the
cuda/11.7.1andgcc/11.2.0modules loaded
OUTPUT
srun: job 12066158 queued and waiting for resources
srun: job 12066158 has been allocated resources
Result: 3.1415535681881 Error: -0.0000390854017 Time: 0.2894s
Result: 3.1416463617890 Error:  0.0000537081992 Time: 0.2065s
Result: 3.1415584281882 Error: -0.0000342254016 Time: 0.2060s
...
The job ran and it it’s about 3.0/0.2 = 15 times faster
than pi-cpu2! You find out from the --help
option, that pi-gpu also has a -p option which
can help you with running the program on more GPUs on the same node. Try
it out with -p 2 and see if you get a 2x speedup.
OUTPUT
srun: job 12066179 queued and waiting for resources
srun: job 12066179 has been allocated resources
Result: 3.1415107353877 Error: -0.0000819182020 Time: 0.4006s
Result: 3.1417724625901 Error:  0.0001798090003 Time: 0.1990s
Result: 3.1413390477862 Error: -0.0002536058036 Time: 0.1988s
...
The speedup seems to be minimal!
Introducing nvtop
Let’s investigate the program’s behavior on the GPUs. We’ll do this
with sbatch --wrap:
OUTPUT
Submitted batch job 12066180Now, ssh to the node you’ve been allocated and execute the
nvtop command:
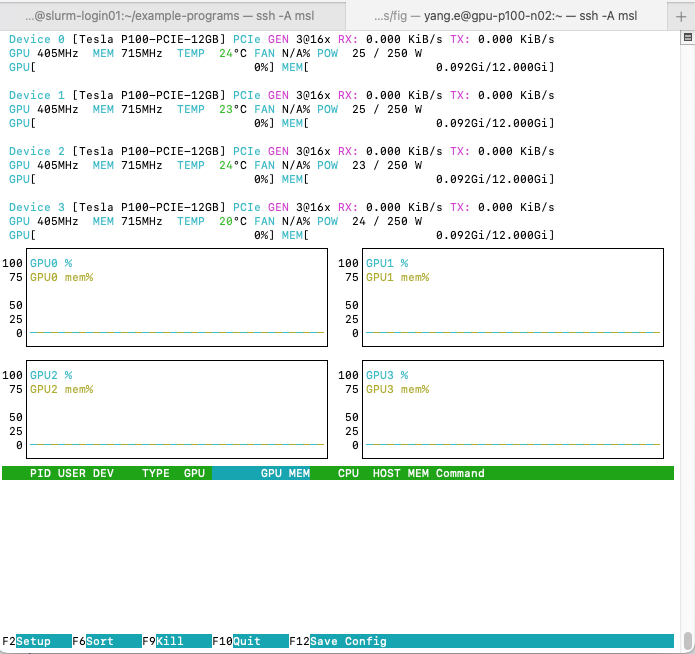
A terminal user interface should open that looks similar to:
 Your output may differ if other
people’s jobs are running on the same node. The interface will be
reminiscent of
Your output may differ if other
people’s jobs are running on the same node. The interface will be
reminiscent of htop but with differences:
- The top section doesn’t show the CPU utilization bars. Instead, they show information about the device (we won’t be covering this section).
- The middle section shows a time-series chart of each GPU’s compute (cyan) and memory (olive) utilization percentage over time.
- The bottom section shows process information in a format similar to
htop:-
PID: process ID, which will correspond to a process onhtop -
USER: The user the process is owned by -
DEV: the GPU ID the process is running on -
GPU: the “compute” utilization of the GPU (in percentage) -
GPU MEM: the memory utilization of the GPU (in MB) -
CPU: the CPU utilization of the process -
HOST MEM: the CPU memory utilization of the process -
Command: the command that the GPU is running
-
nvtop is a useful tool in evaluating utilization of the
GPU while your job is running. This tool can be used as a way to check
that
- the GPUs you requested are actually being used, and
- that they are being fully utilized
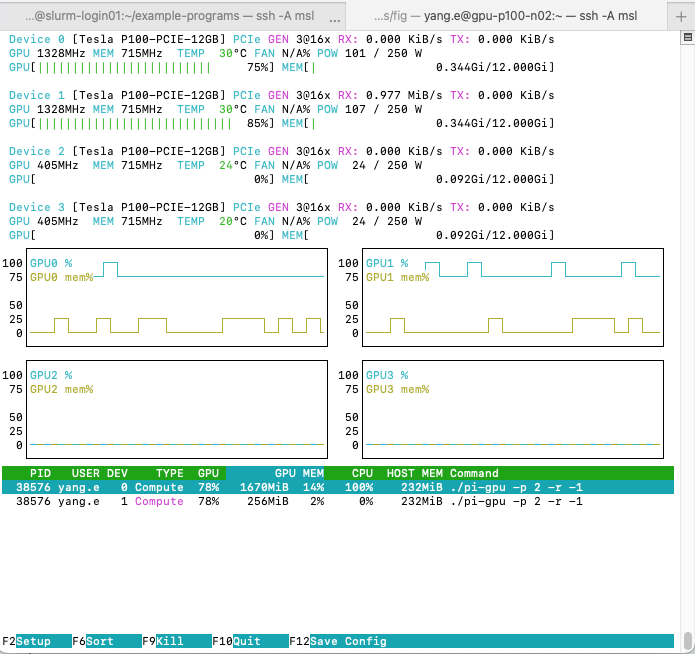
nvtop interface with
pi-gpu -p 2 -r -1 runningTwo processes should show up in the process list with your
pi-gpu command. You will also see that utilization charts
move.
In the process list, you will see two entries corresponding to the
two GPUs that pi-gpu is using. Under DEV you
will see the device IDs which pi-gpu is using. In the
example screenshot above, they are GPU 0 and GPU 1. But,
nvtop shows the information for all the GPUs on the node by
default.
Interpreting nvtop output
A good place to start when determining if your program is using the GPU well is looking at the utilization. Many programs have parameters which can affect this utilization - especially programs that process data.
Many programs process data on the GPU in chunks as the GPU memory is typically too small to handle the entire data set at once. These are often controlled through chunk size or number of chunks parameters (you might also see the word “block” being used instead). Typically, you want to tune the parameters such that utilization is high.
Key Points
- Requesting more resources from Slurm doesn’t mean your job knows how
to use them!
- Many programs don’t work in parallel by default - either that functionality doesn’t exist, or needs to be turned on!
- More CPUs doesn’t always mean an equivalent speedup!
- Slurm offers multiple utilities to monitor your jobs. Each serving a
slightly different purpose
-
squeueis for running/pending jobs and only provides status/request information -
sacctandseffis best for complete jobs and provides resource utilisation where available -
sstatis for running jobs and provides a snapshot of resource utilisation
-
- The
htopsystem tool is a great way to get live information about how effective your job is- is more robust and provides more details than Slurm monitoring tools
-
nvtopoffers something similar tohtop, but for GPU processes.